25 Sept 2026, 10:09 am
3 Candle Signals Before a Big Move
Most people only notice a stock after it has already moved. Before that happens, the candles are usually giving small clues, if you know what to check.
I recently studied this pattern on SONACOMS, and it is a good example of what those clues can look like.
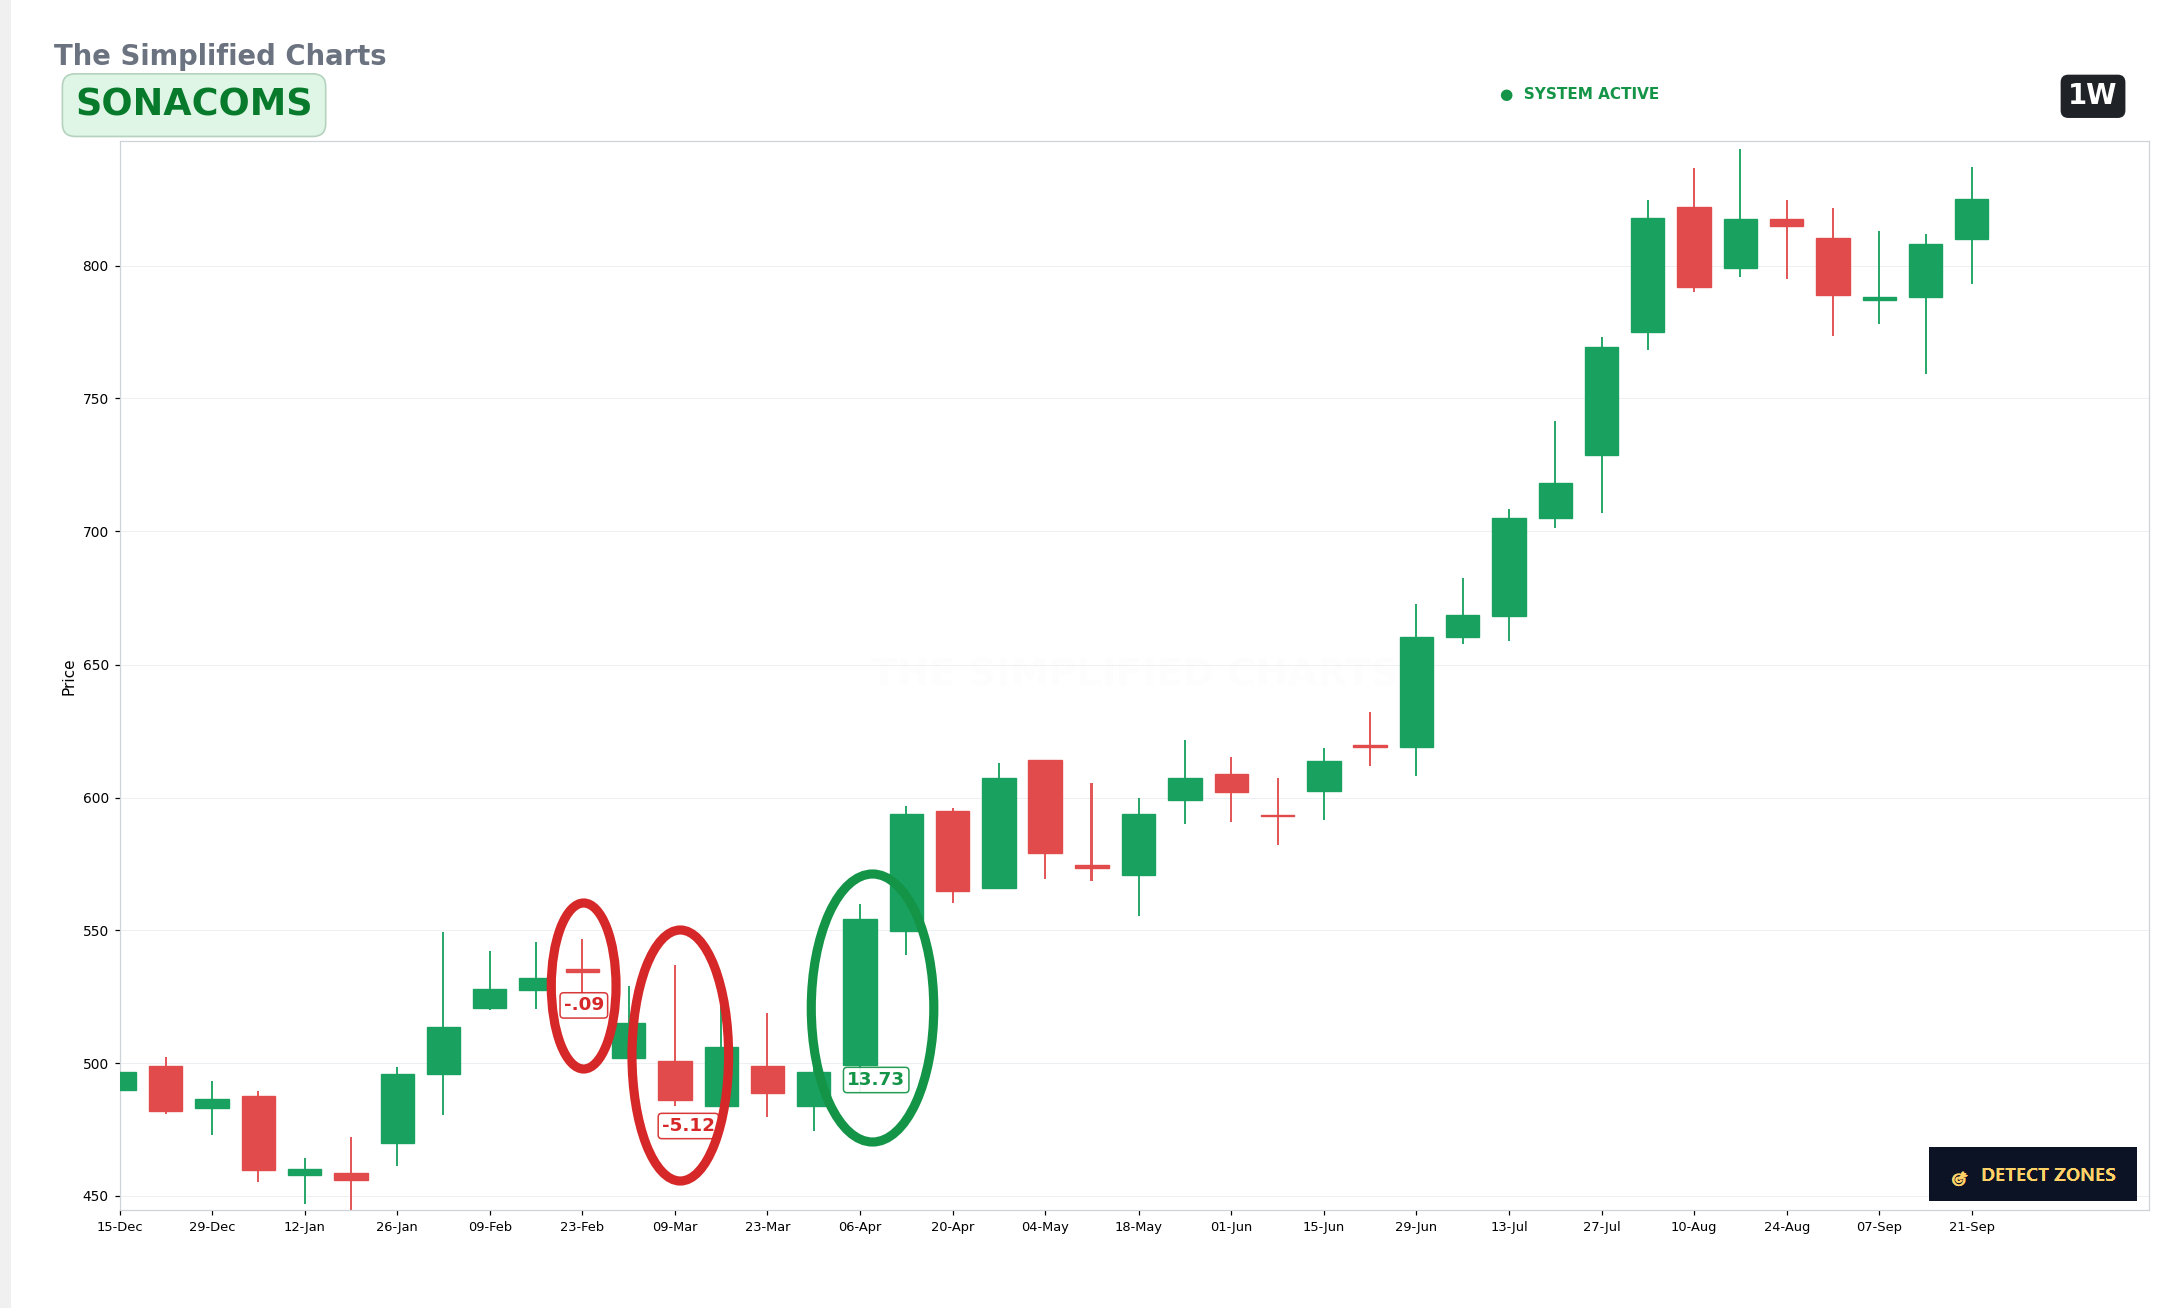
Signal 1: A weak candle (Score: -.09)
The first candle printed a score close to zero. Not strongly negative, just indecisive. On its own, this told me nothing was worth acting on yet.
Signal 2: A clearly negative candle (Score: -5.12)
A couple of weeks later, a stronger negative candle showed up. This is the kind of candle that usually keeps retail traders on the sidelines, because it looks like weakness continuing.
Signal 3: The candle that changed the picture (Score: 13.73)
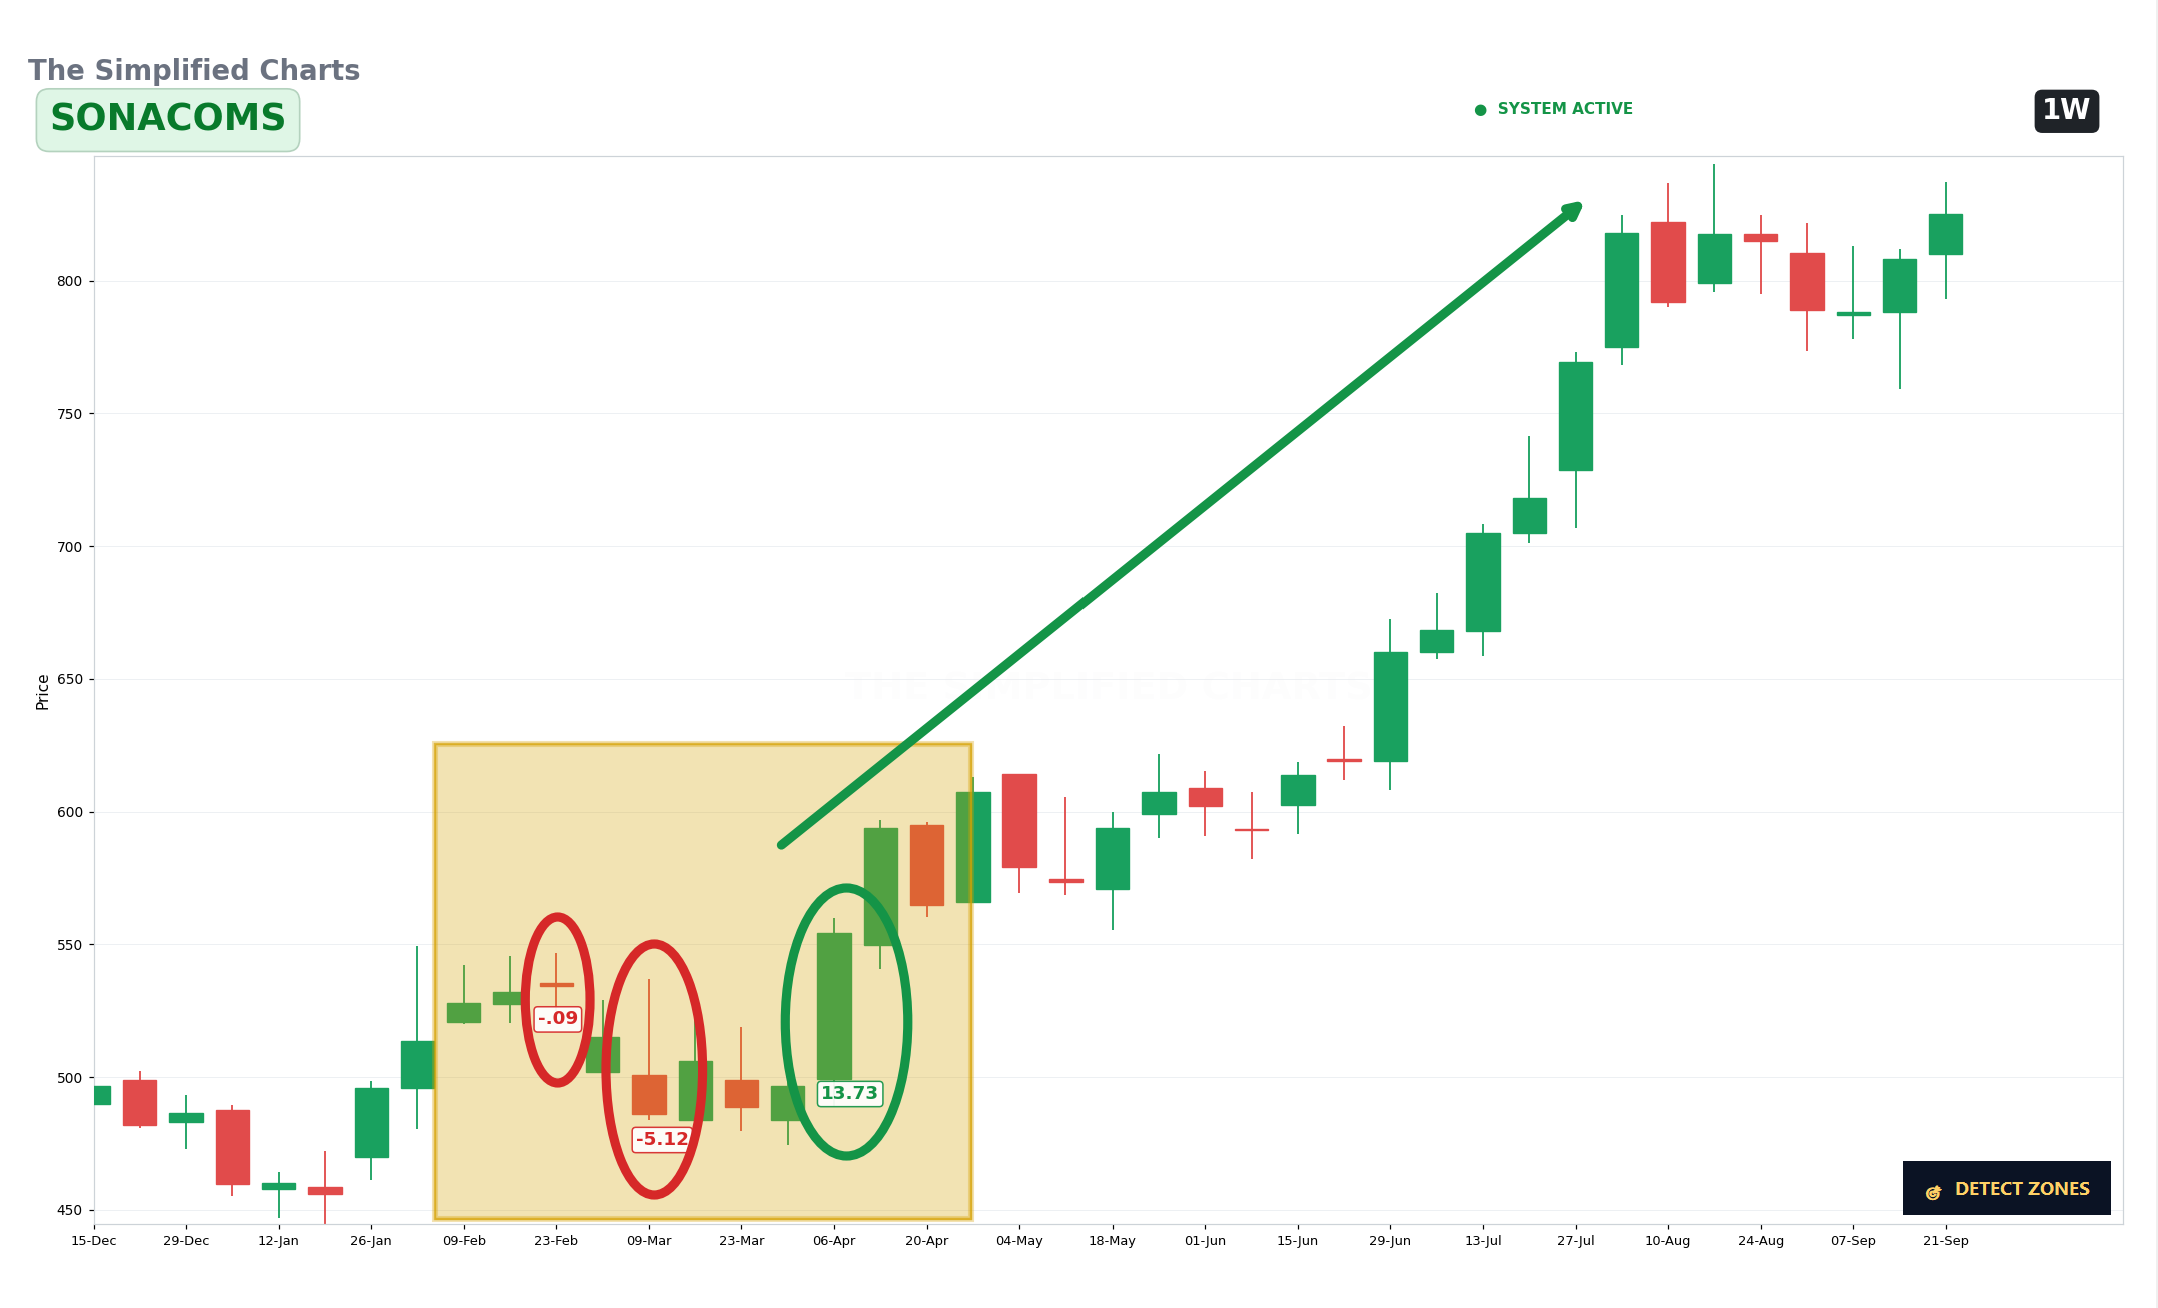
Then a candle scored 13.73, a sharp shift from the two candles before it. This is the kind of change I pay attention to, not the price move by itself, but how much the reading changed from the recent candles.
What happened after
From that zone, the stock moved sharply higher over the following months, without a major score-negative candle interrupting the move.
What I check for
Is the score changing direction, not just the price?
Is the shift big enough to matter, or just noise?
Does the candle after the shift confirm it, or reverse it?
I am not saying every strong-score candle leads to a move like this. Some don't. SONACOMS is one example where the shift lined up with a larger move.
Full breakdown with the chart in my video here.
Educational and informational content only. Not SEBI-registered. This is not financial or investment advice. Please do your own research before making any investment decision.
Join the discussion