Shorts
All synced Shorts from The Simplified Charts, newest first.

Big Move? Our New Website Shows What's Next
The Simplified Charts website brings simple Indian stock market analysis, chart insights, price levels and video breakdowns into one place.
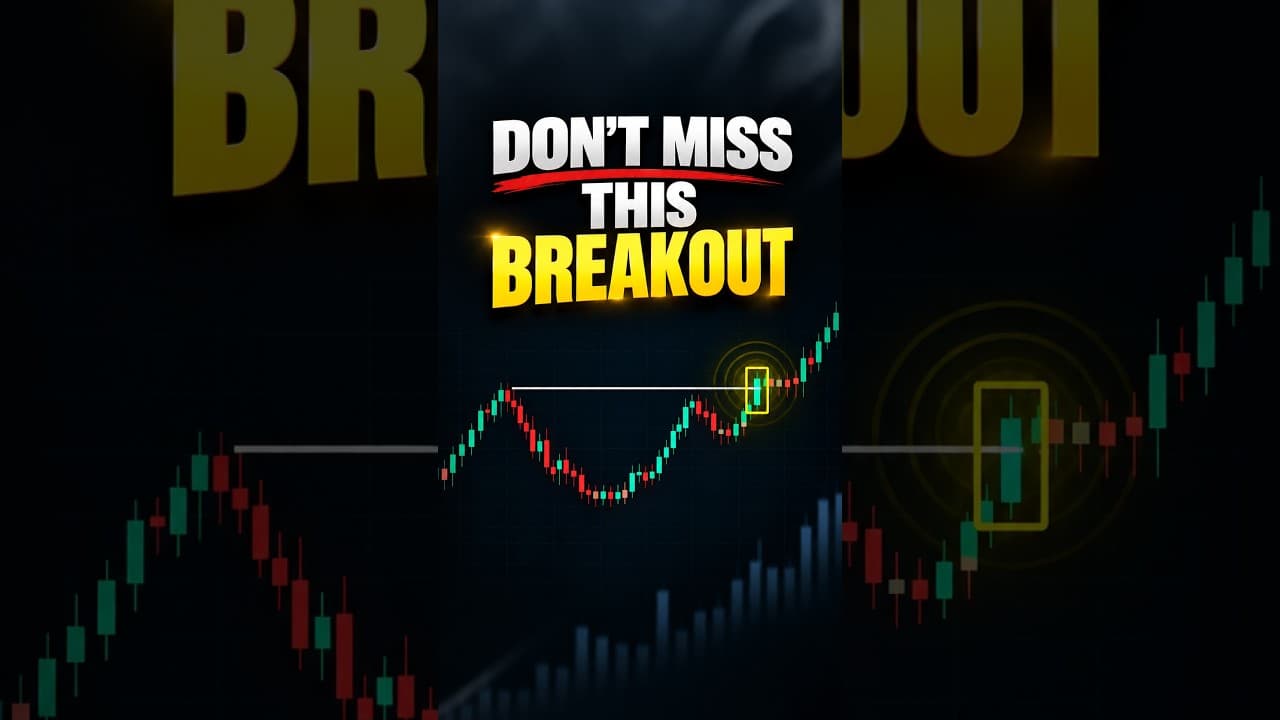
Cup & Handle Pattern: How to Spot the Breakout
Cup and Handle pattern explained simply, including the cup, handle, breakout and our simplified breakout scoring approach.

BSE Falling? These Kids Have a Funny Theory
Funny BSE stock market Short featuring kids reacting to a market fall with a playful and humorous take.
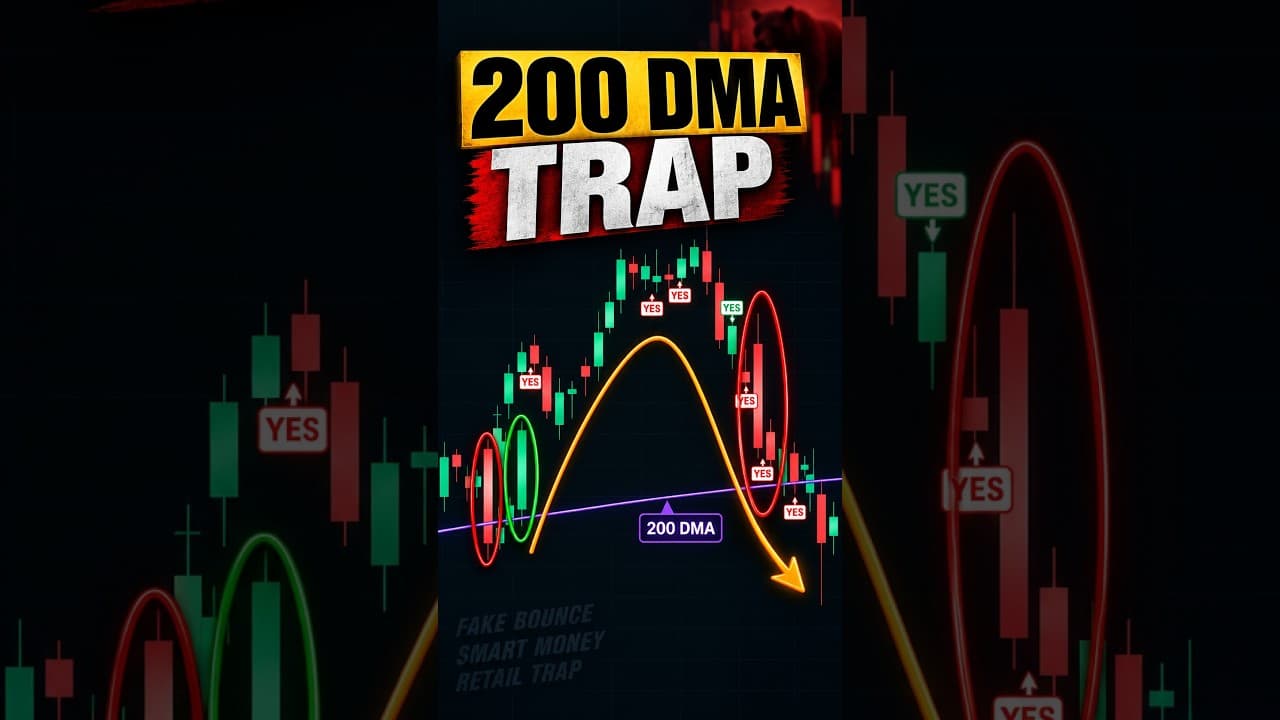
200 DMA Bounce: Why It Can Mislead Traders
200 DMA explained through a chart example, showing false bounces, price action, fake breakouts and why traders should check market structure.

998… 999… 1000 ❤️ We Did It! | 1K Subscribers
The Simplified Charts celebrates 1,000 subscribers with a thank-you Short and looks ahead to the next milestone of 10,000 subscribers.

Why Does a Stock Fall Right After You Buy It?
Why does a stock fall after you buy it? Learn how price action, market structure and a system-based approach can improve trade selection.

How Is the Closing Price Decided? SEBI's New CAS Explained
SEBI Closing Auction Session explained simply, covering the 20-minute auction, order matching, equilibrium price and how the final closing price is set.
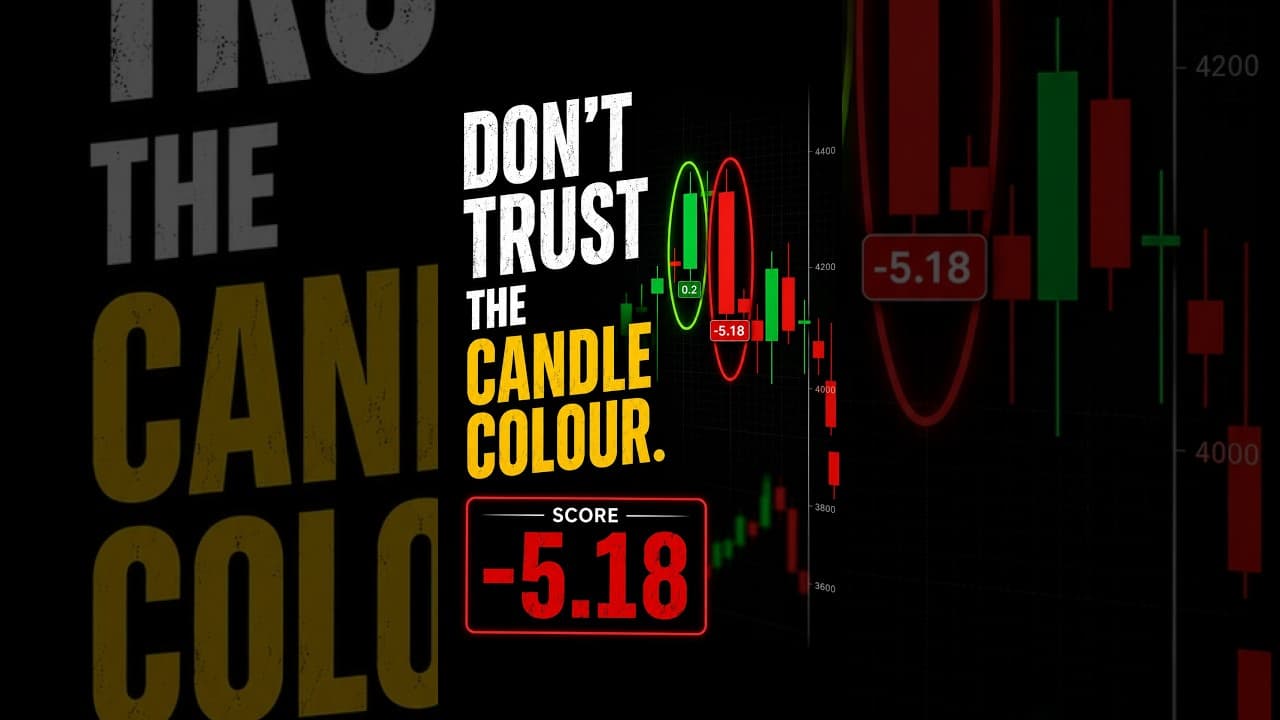
Green or Red Candle? Why Colour Alone Can Mislead
Green or red candle? Learn why candlestick colour alone can mislead and how multiple market signals can provide a more complete view of price action.
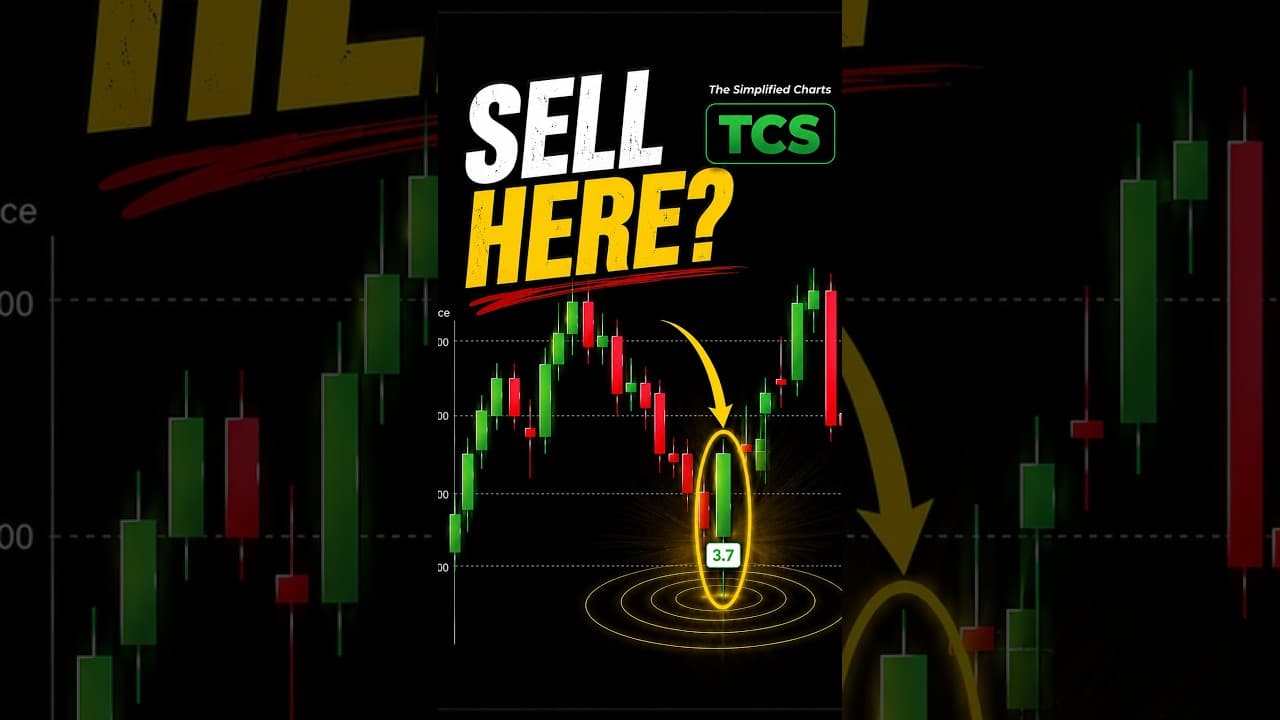
Buying Climax: How to Spot a Fake Reversal Before the Drop
Buying climax explained with a chart example, showing fading buying pressure, strong rejection, buyer exhaustion and possible reversal signals.
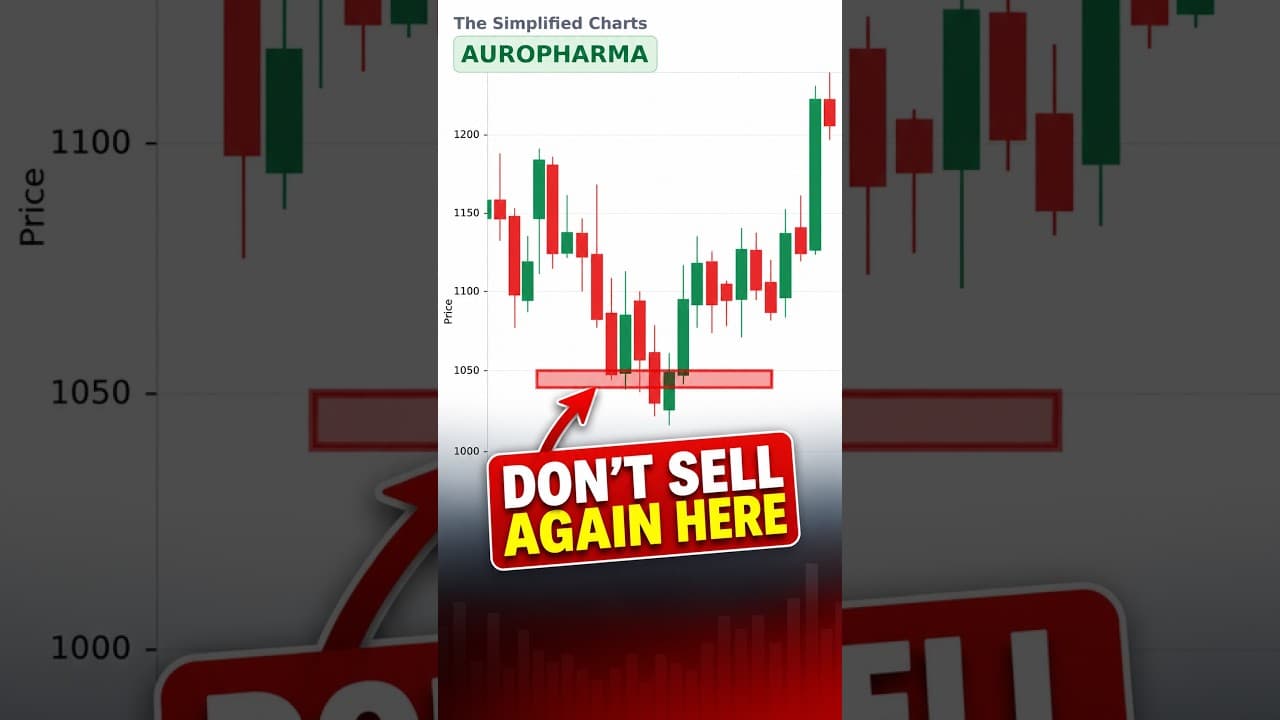
Fake Breakdown: Where Smart Money Actually Buys
Fake breakdown explained with a chart example, showing fading selling pressure, buying confirmation, base formation and breakout structure.

Bulls or Bears? Why Predicting the Market Fails Traders
Why does predicting bulls or bears fail? Learn why traders can benefit from waiting for a confirmed setup instead of guessing the market's next move.

Which Stocks to Track? Which Trigger to Check? | The Simplified Charts
Learn a simple stock analysis workflow using weekly support, RSI divergence, 3H trigger candles and support and resistance levels.

Why Retail Investors Always Average Into Losses
Averaging down explained: understand the averaging trap, falling stocks, trading psychology and why fresh confirmation matters before adding to a position.

Average a Falling Stock or Wait? Read the Chart
Should you average a falling stock or wait? Learn how support, resistance and price confirmation can help evaluate the setup before adding a position.

Averaging Down on Stocks: Mistakes Retail Investors Make
Averaging down explained through common retail investor mistakes, with practical points to consider before adding more to a falling stock.
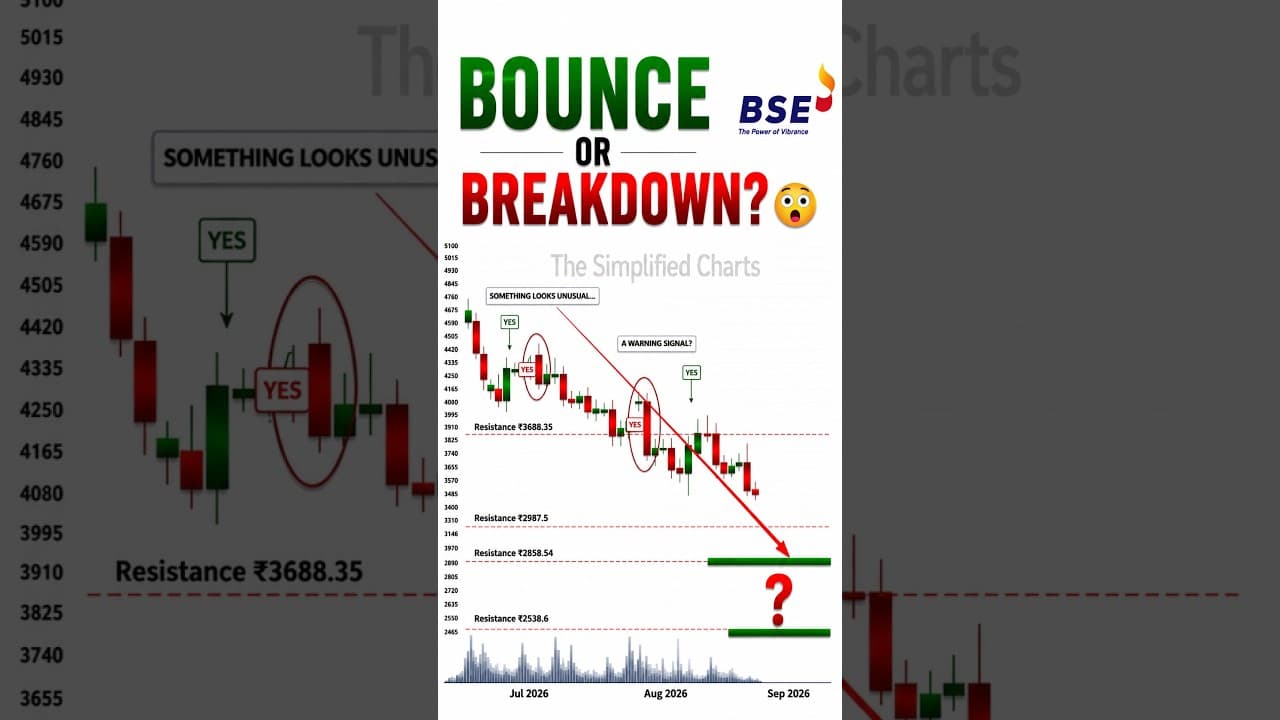
How to Spot a Breakdown Before It Happens
BSE price action explained with support and resistance, buying pressure and chart structure to understand signs of a possible breakdown.
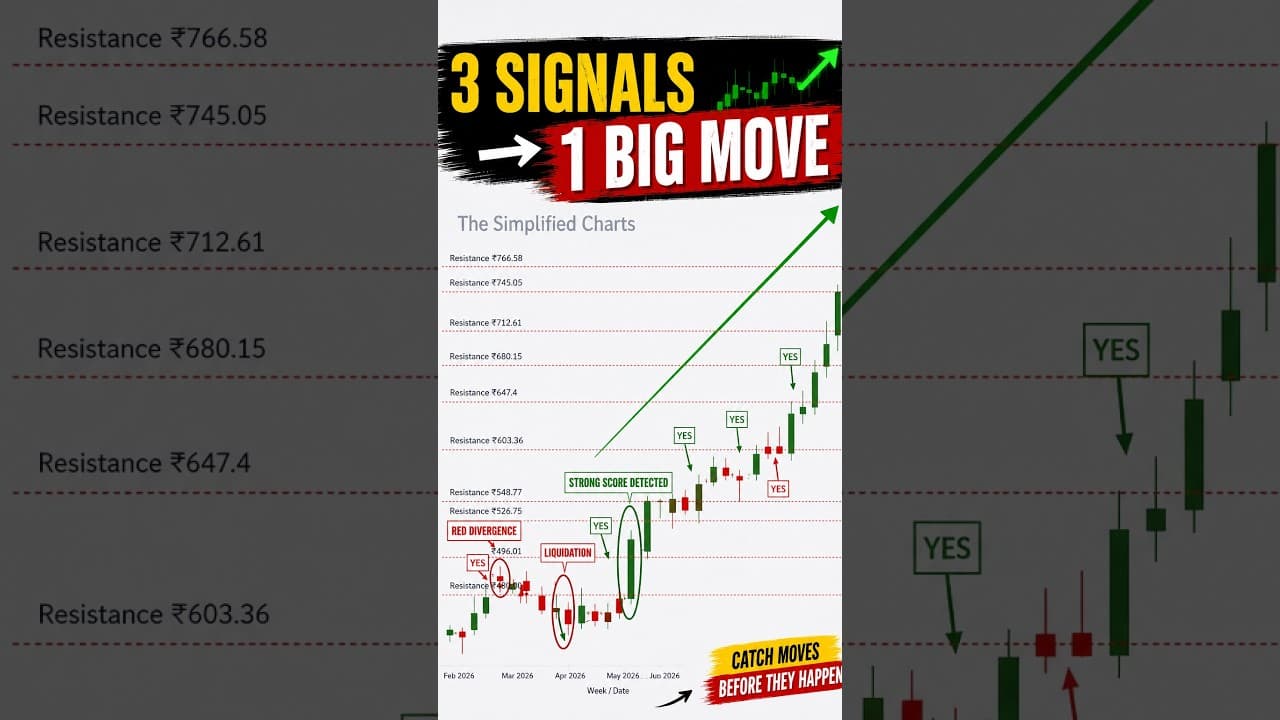
RSI Divergence to Breakout: Signals Before a Rally
RSI divergence explained with a chart example, showing liquidation, breakout confirmation and signals that can appear before a major price move.