22 Sept 2026, 10:50 am
BSE Share: Was the Warning Already Visible? My Candle Score Breakdown
BSE Share looked strong near the top. But what if the warning was already visible?
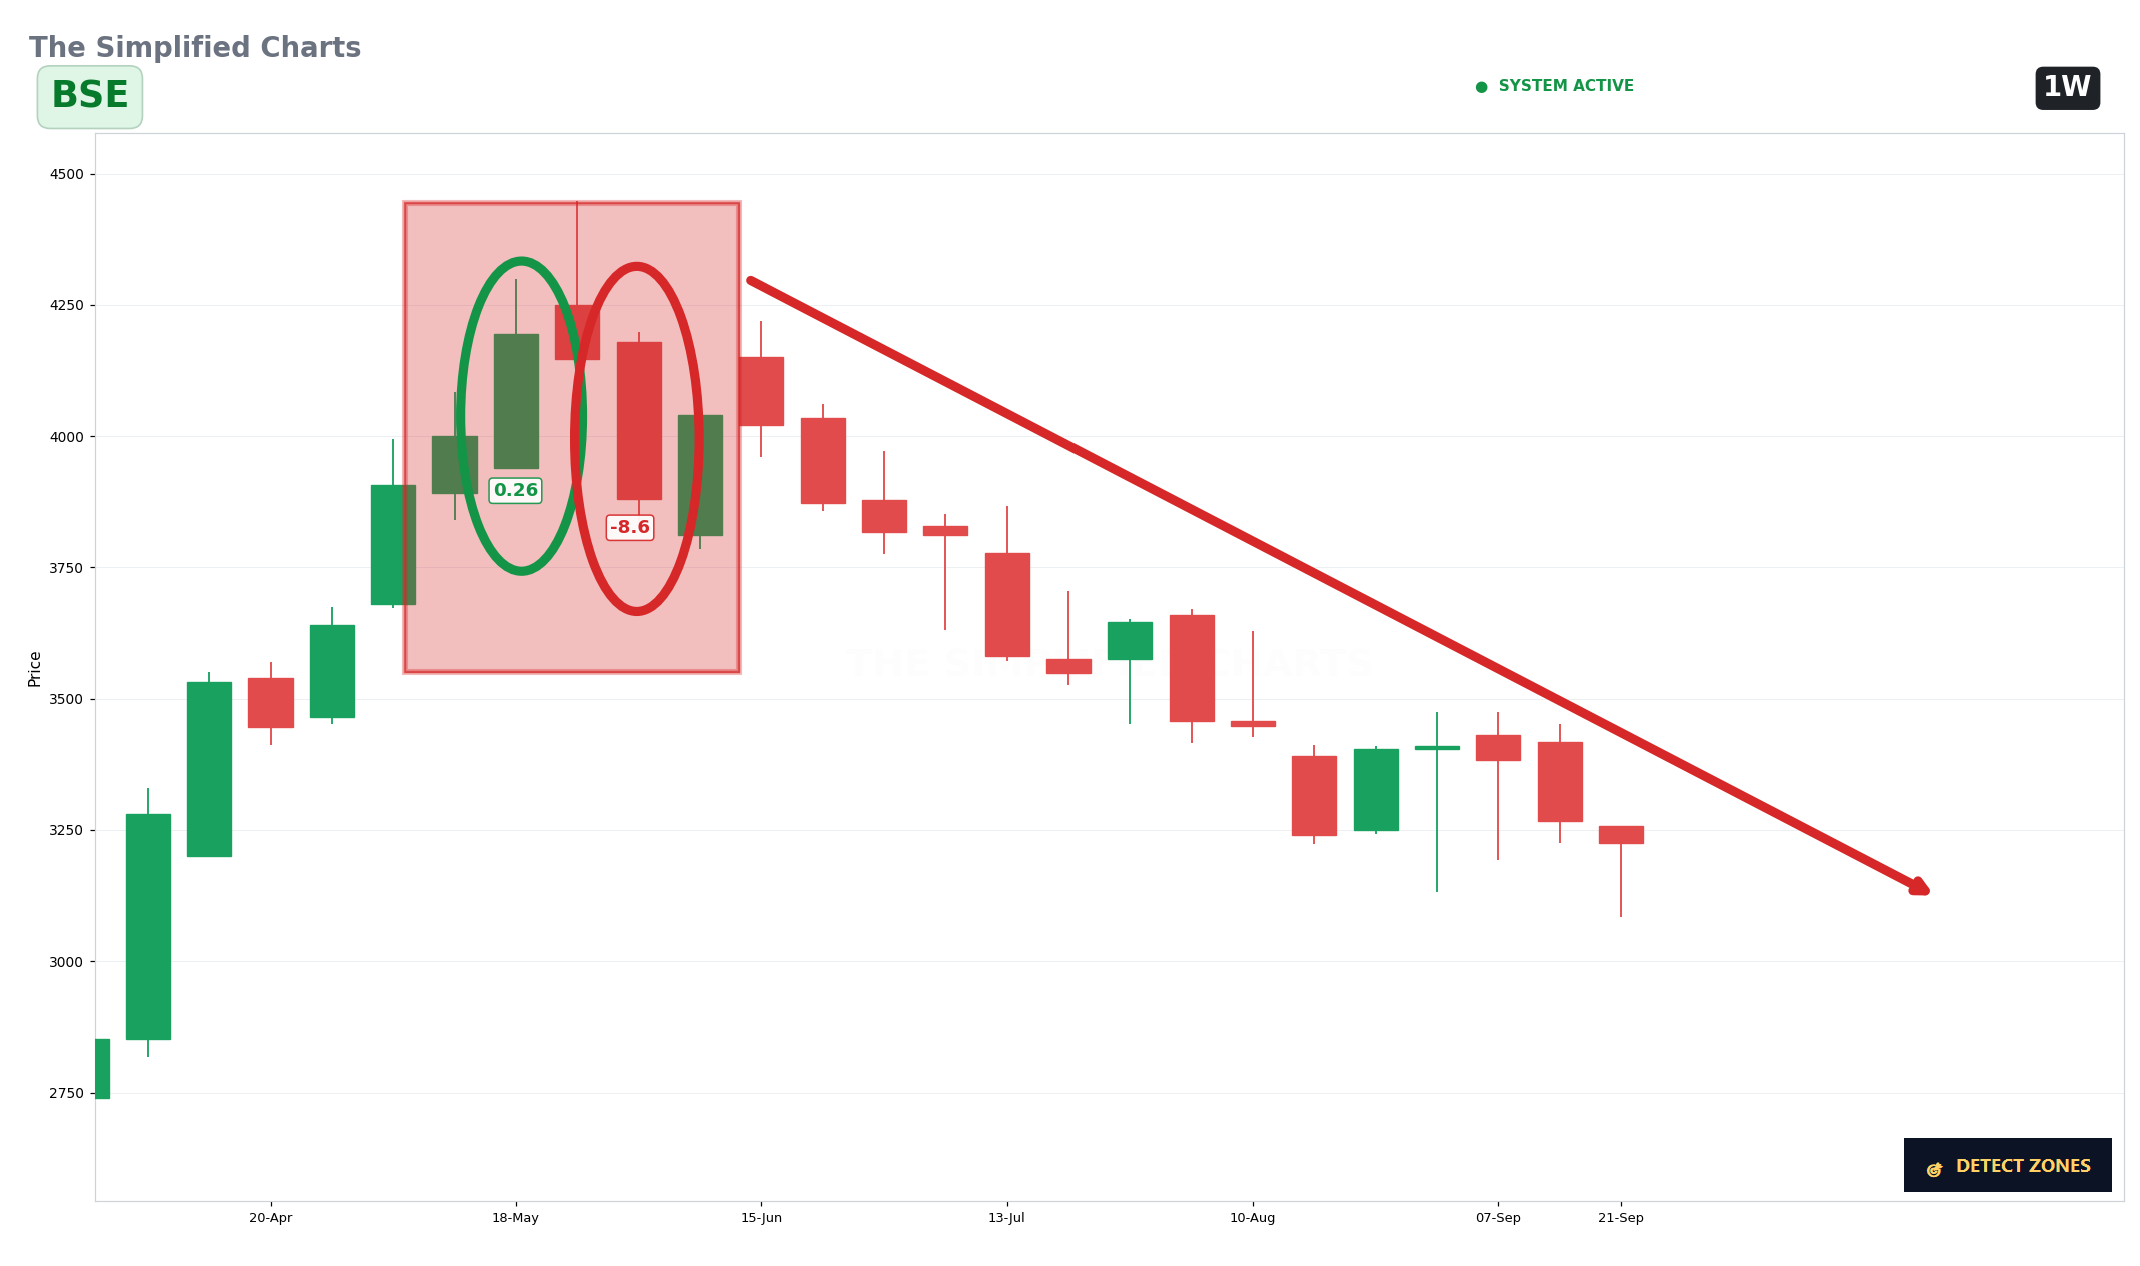
The first chart shows the area where my system detected a change in the candle behaviour.
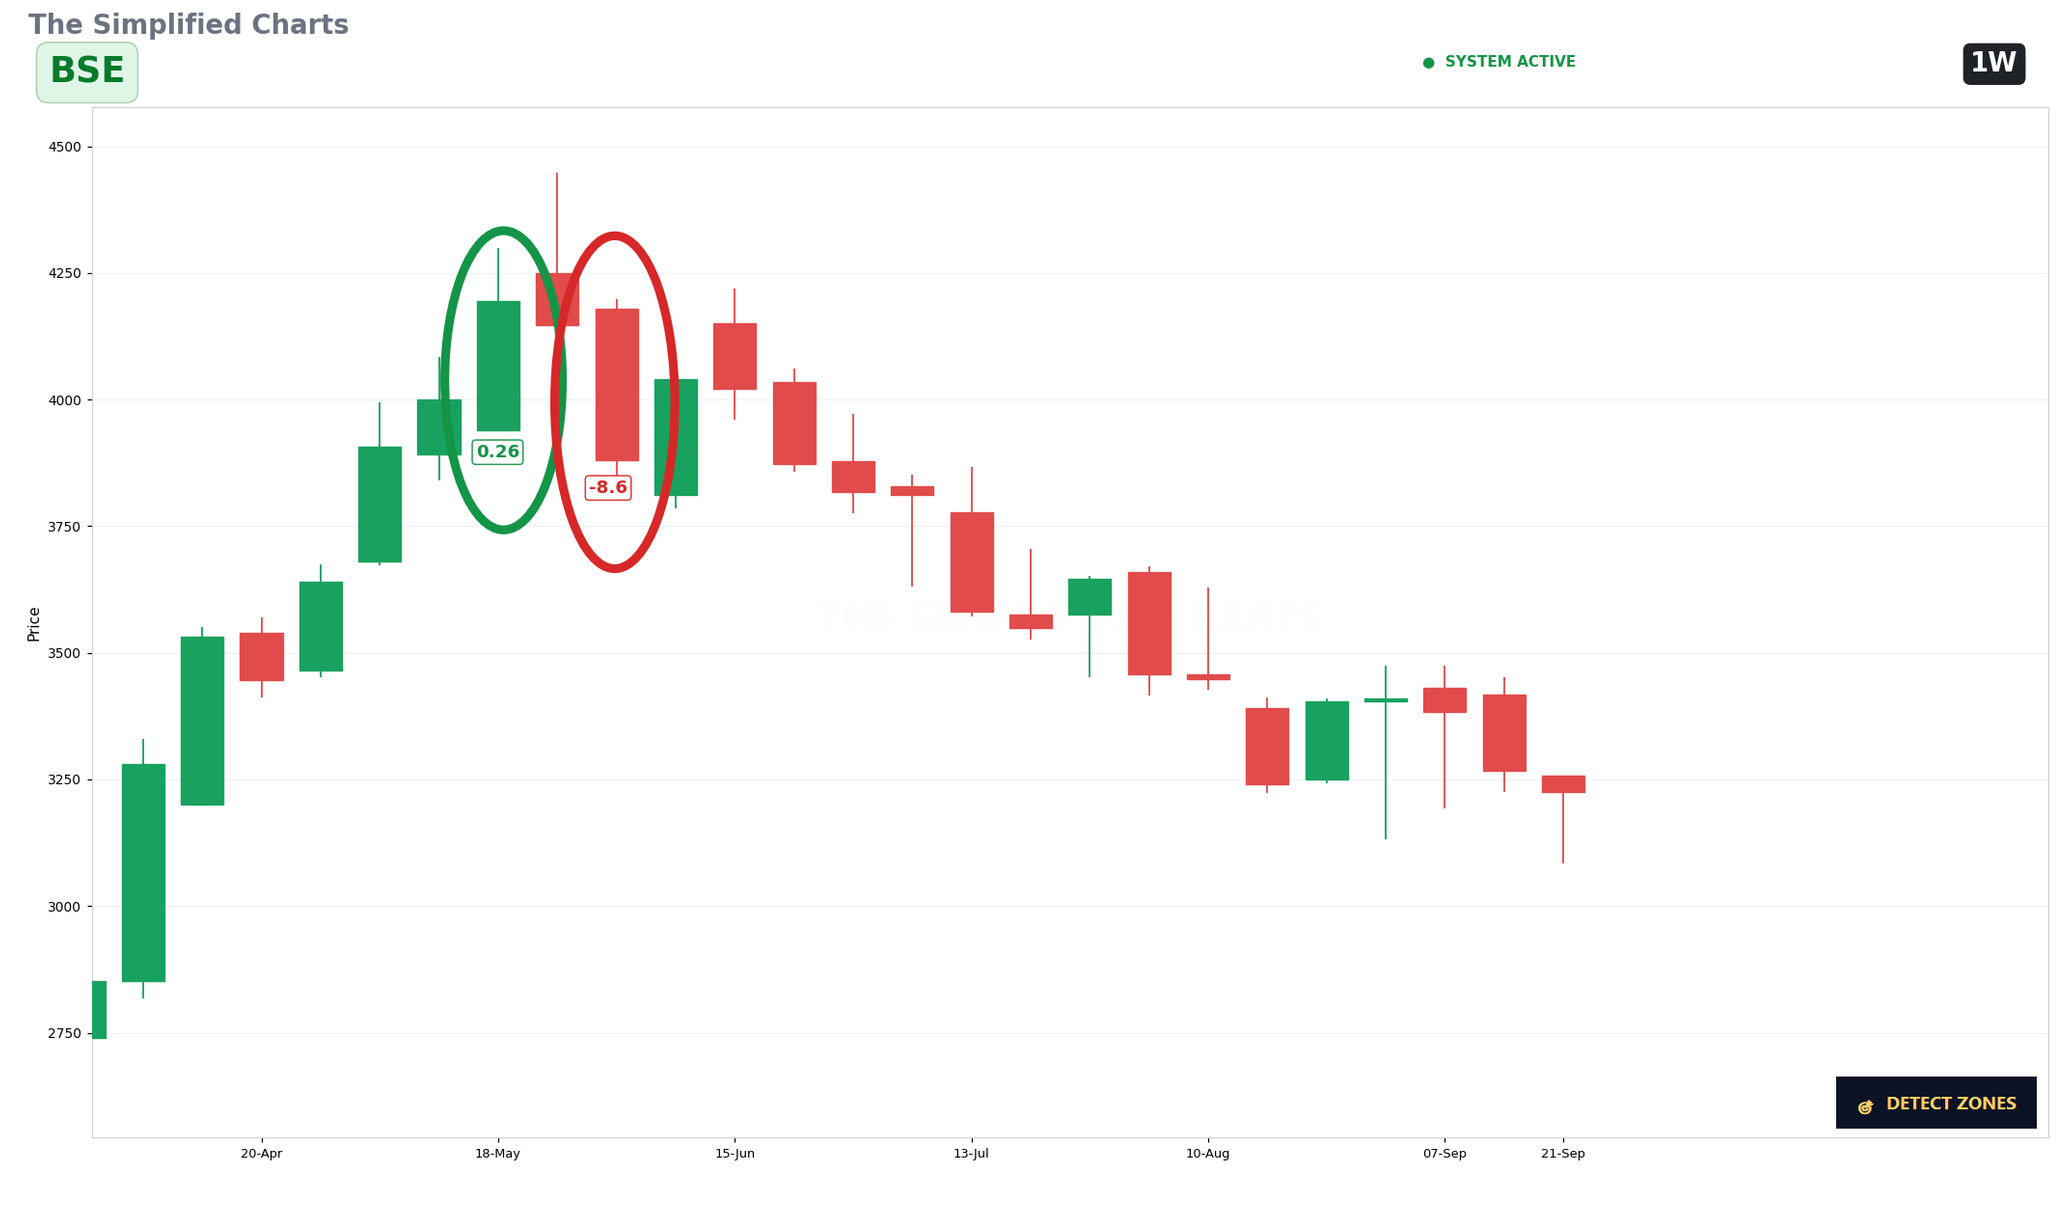
The second shows what happened afterwards.
What caught my attention was the Candle Score:
• Buyers Losing Strength: +0.26 Score
• Warning Candle: -8.6 Score
• After that: Price started moving into a sustained decline
The interesting part is that the warning did not come from simply seeing a red candle.
My Candle Score system looks at a combination of price action, volume, liquidity and market structure to understand what the candle may be indicating.
A small positive score near the top followed by a much stronger negative score can become an important area to investigate.
I’m not claiming the system predicts every move.
The goal is to identify signals worth paying attention to before the broader move becomes obvious.
This BSE example is one of the setups I use to test whether the framework can consistently detect changes in market behaviour.
I’ve spent around 3 years building and testing this Candle Score system, and this is exactly the kind of market structure I’m trying to decode.
Not every warning leads to a fall. But every strong move is worth studying for the signals that appeared before it.
Educational and informational content only. Not SEBI-registered. This is not financial or investment advice. Please do your own research before making any investment decision.
Join the discussion