24 Sept 2026, 4:39 pm
Everyone Talks About the 200 DMA. Almost Nobody Checks This Before Acting On It
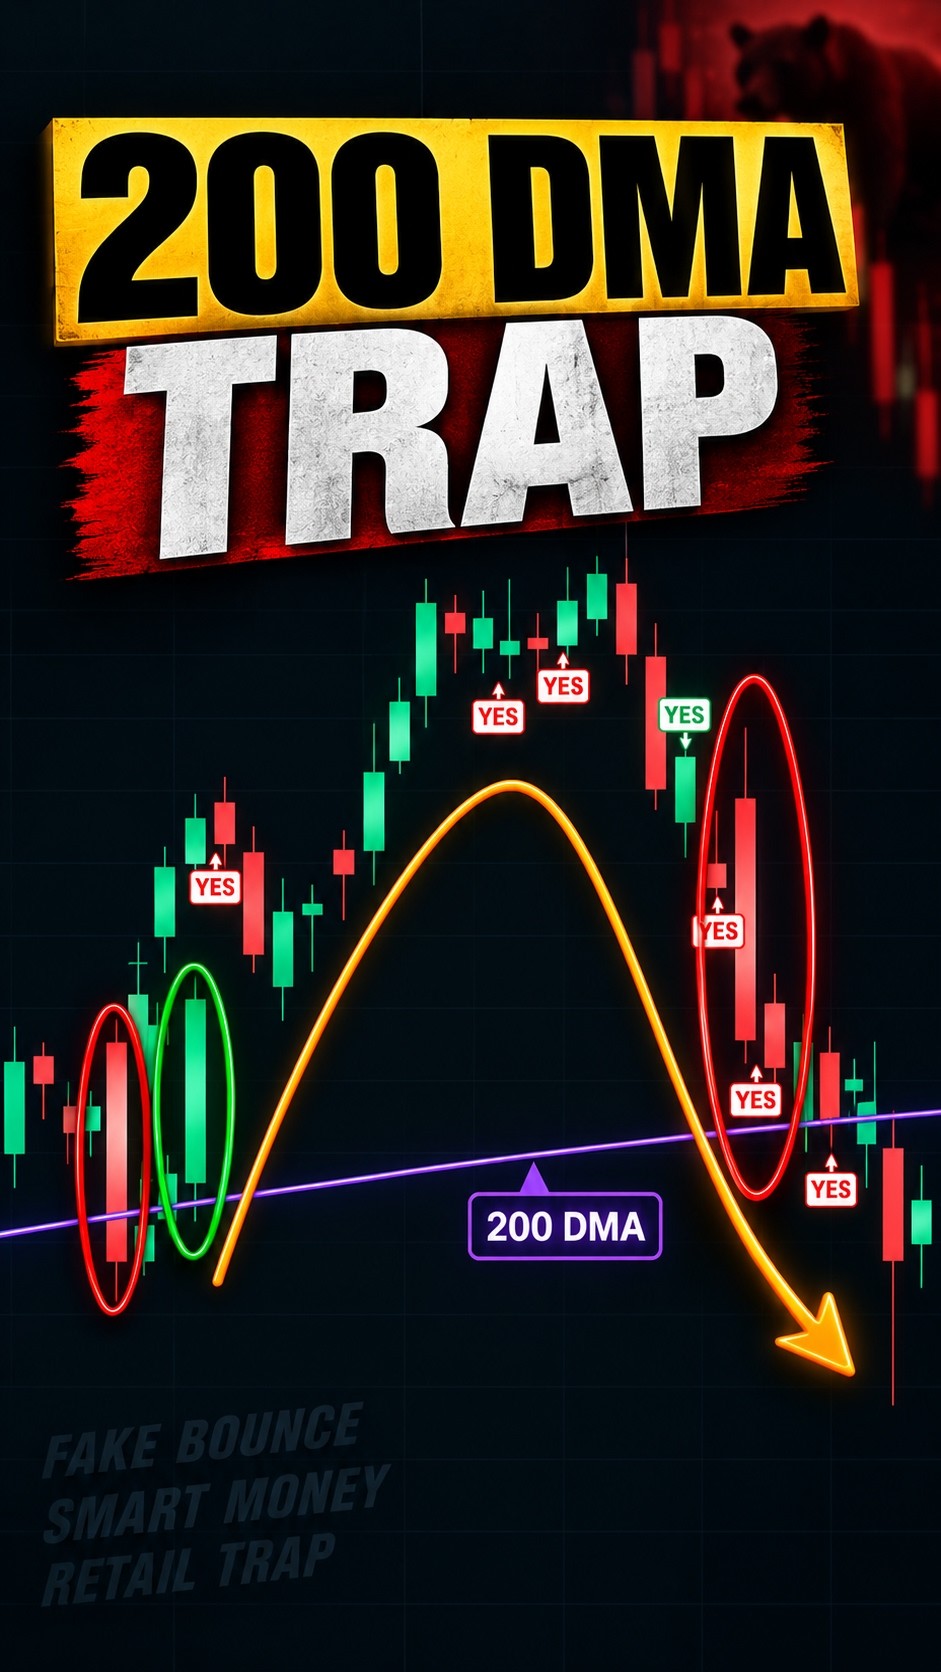
Every second post says "the stock is near its 200 DMA, so buy" or "the stock broke its 200 DMA, so sell."
I have been studying charts for about 3 years, and one thing I noticed is that the touch itself is not the signal. What the candle does at that level is.
Same line, different outcomes
Two stocks can reach the same 200 DMA and behave completely differently:
One shows buyers stepping in, with volume and a strong close.
The other shows a weak close, low volume, or a candle that turns negative on my Candle Score.
If you act only because of the line, you treat both the same.
What I check instead
When price reaches this area, I look at:
Is the Candle Score turning up or down at this level?
Is volume supporting the move?
Where is the candle closing in its range?
A line is an area, not an exact price
Price rarely reacts at one exact number. Treat the 200 DMA as a zone, and wait to see what the candle shows inside it.
I am not saying this predicts every move. No indicator does. I use it to decide what is worth paying attention to, not to promise an outcome.
Worked examples with charts: watch the full video below, where I show this on real charts.
Educational and informational content only. Not SEBI-registered. This is not financial or investment advice. Please do your own research before making any investment decision.
Join the discussion