12 Sept 2026, 6:20 pm
TCS Has Fallen a Lot Since 2024 - How My System Score Identified Warning Signals
TCS looked strong in 2024. But what if the warning was already visible?
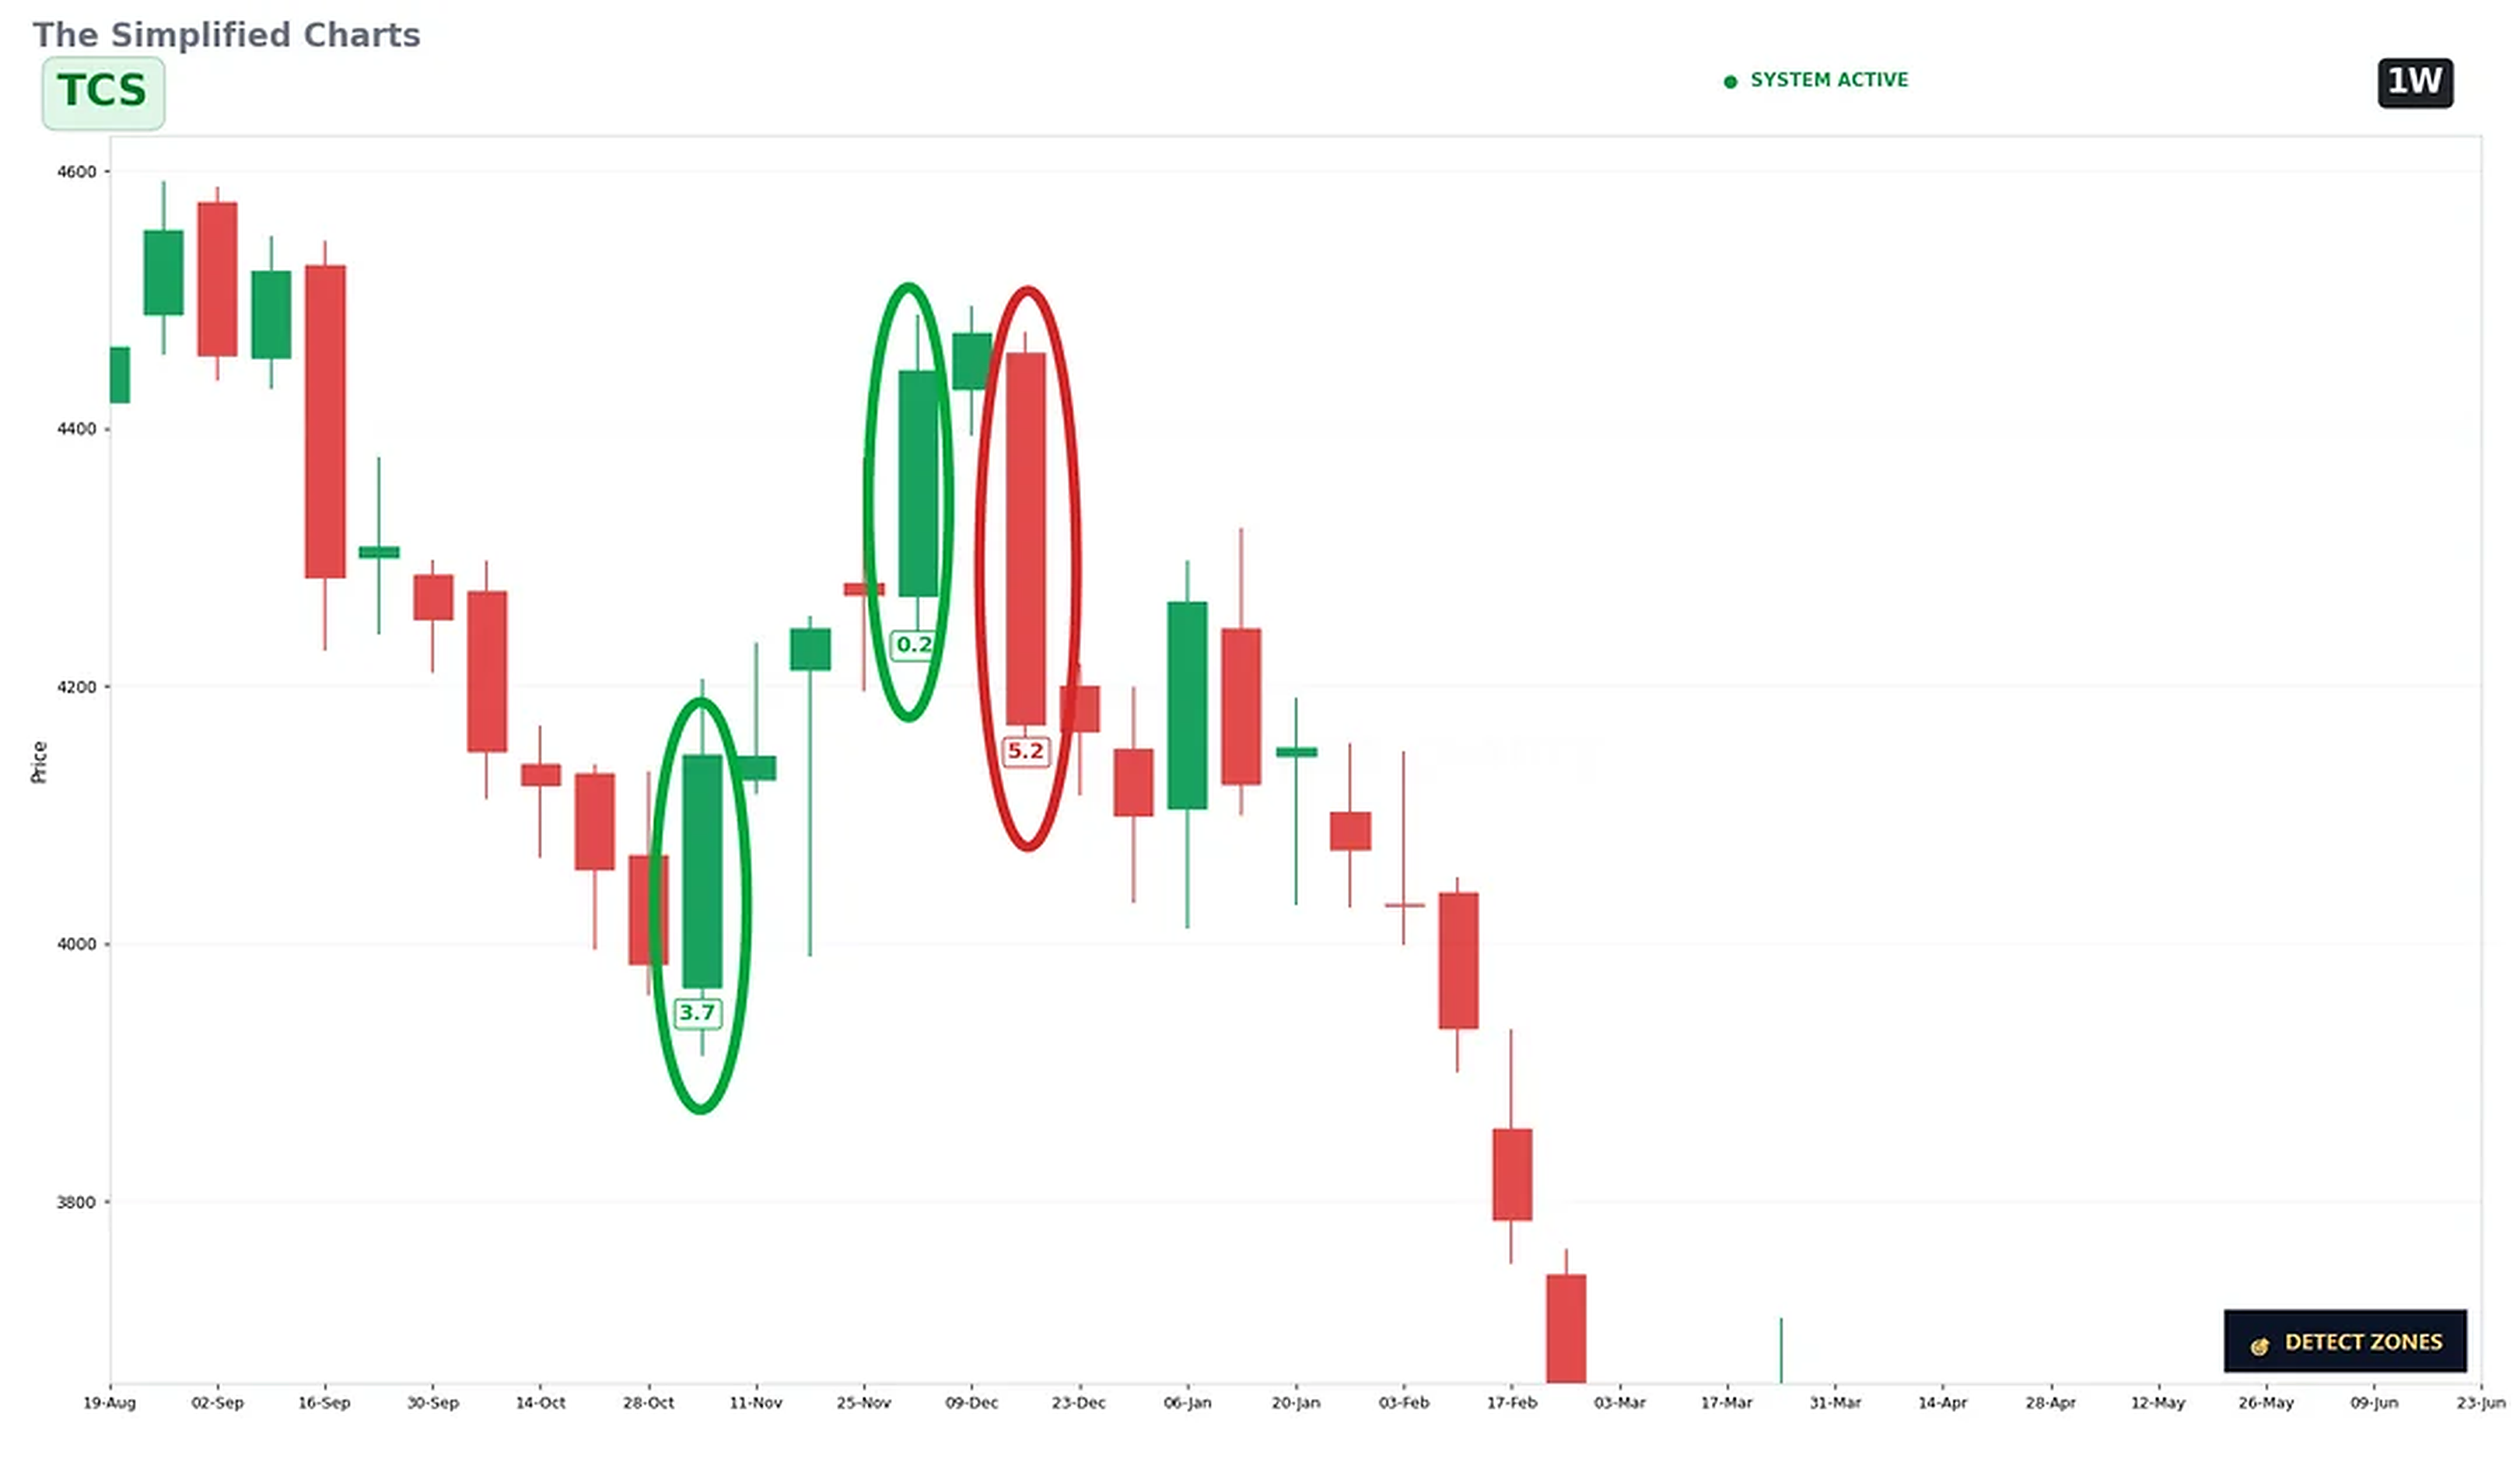
The first chart shows the area where the warning appeared.
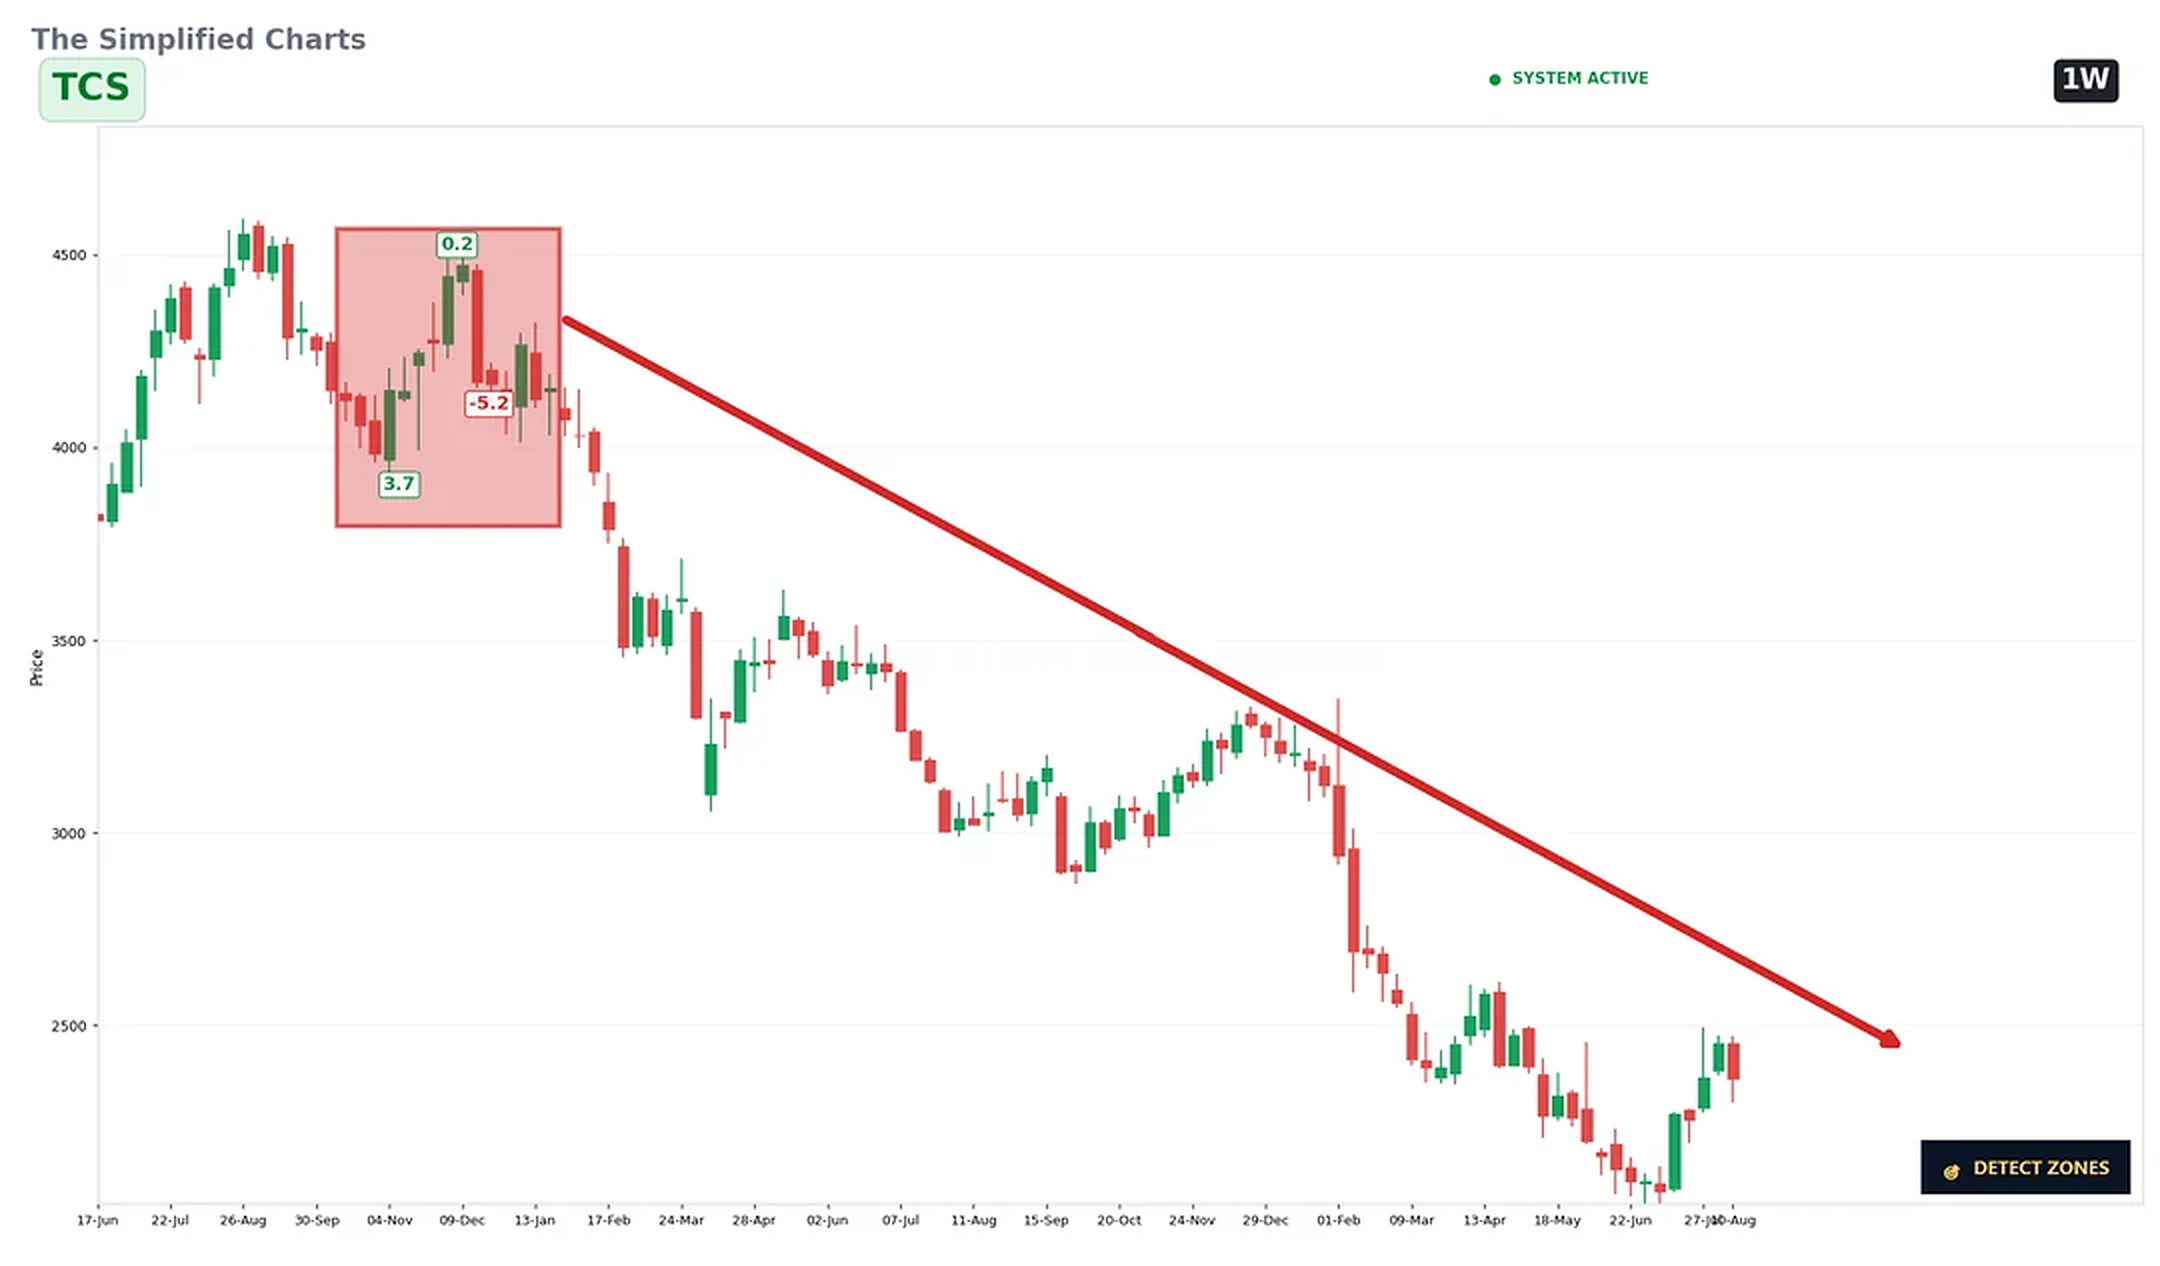
The second shows what happened afterwards.
What caught my attention was the Candle Score:
• Fake Bullish Setup: +3.7 Score
• Buyers Exhausted - the last +3.7 was Retailers FOMO buying: +0.2 Score
• Warning Candle - Smart Money started dumping: -5.18 Score
This is exactly why I spent 3 years building and testing my Candle Score system - to identify warning signals by combining price action, volume, liquidity and market structure instead of judging a candle by its colour alone.
I’m not claiming the system predicts every move.
The goal is to spot signals worth paying attention to BEFORE the move becomes obvious.
We’re trying to decode the smart-money footprints behind the candles and turn them into a systematic score.
This TCS example is one of the setups I use to test the framework.
If you’re interested in following how I’m building and testing the system, stick around.
Educational and informational content only. Not SEBI-registered. This is not financial or investment advice. Please do your own research before making any investment decision.
Join the discussion